
In the era of data-driven decision making, presentations are no longer just about delivering slides — they are about measuring engagement, collecting insights, and improving outcomes. This is where a presentation report becomes essential.
A presentation report helps presenters understand what actually happened during a session: who participated, how engaged the audience was, which slides worked, and which parts need improvement. With tools like EngageSlide, presentation reporting moves beyond static numbers and becomes a powerful analytics system for interactive presentations.
This article explores what a presentation report is, why it matters, and how EngageSlide helps teams turn presentations into actionable data — illustrated by a real report dashboard example.
What Is a Presentation Report?
A presentation report is a structured summary of all data collected during and after a presentation. It typically includes:
Number of participants
Total responses or submissions
Audience engagement metrics
Poll, quiz, and survey results
Q&A interactions
Slide-level performance analytics
Unlike traditional presentation summaries that rely on assumptions or feedback forms, modern presentation reports provide real-time, behavior-based data.
Why Presentation Reports Matter More Than Ever
1. Measure Real Engagement, Not Assumptions
Attendance does not equal engagement. A presentation report reveals:
How many participants actually interacted
Which slides triggered responses
Where engagement dropped or peaked
This allows presenters to move from guesswork to evidence-based improvements.
2. Improve Future Presentations
With slide-level reporting, you can:
Identify confusing questions
Refine quiz or poll design
Optimize presentation flow and timing
Each report becomes a learning tool for future sessions.
3. Prove Impact to Stakeholders
For trainers, HR teams, educators, and agencies, presentation reports are critical for:
Demonstrating training effectiveness
Reporting results to clients or management
Justifying budget and ROI
How EngageSlide Approaches Presentation Reporting
EngageSlide is built around interactive presentations, which means reporting is not an afterthought — it is a core feature.
Instead of static summaries, EngageSlide offers a centralized presentation report dashboard that is:
Visual
Easy to understand
Actionable
Exportable
Overview Dashboard: Instant Insights at a Glance
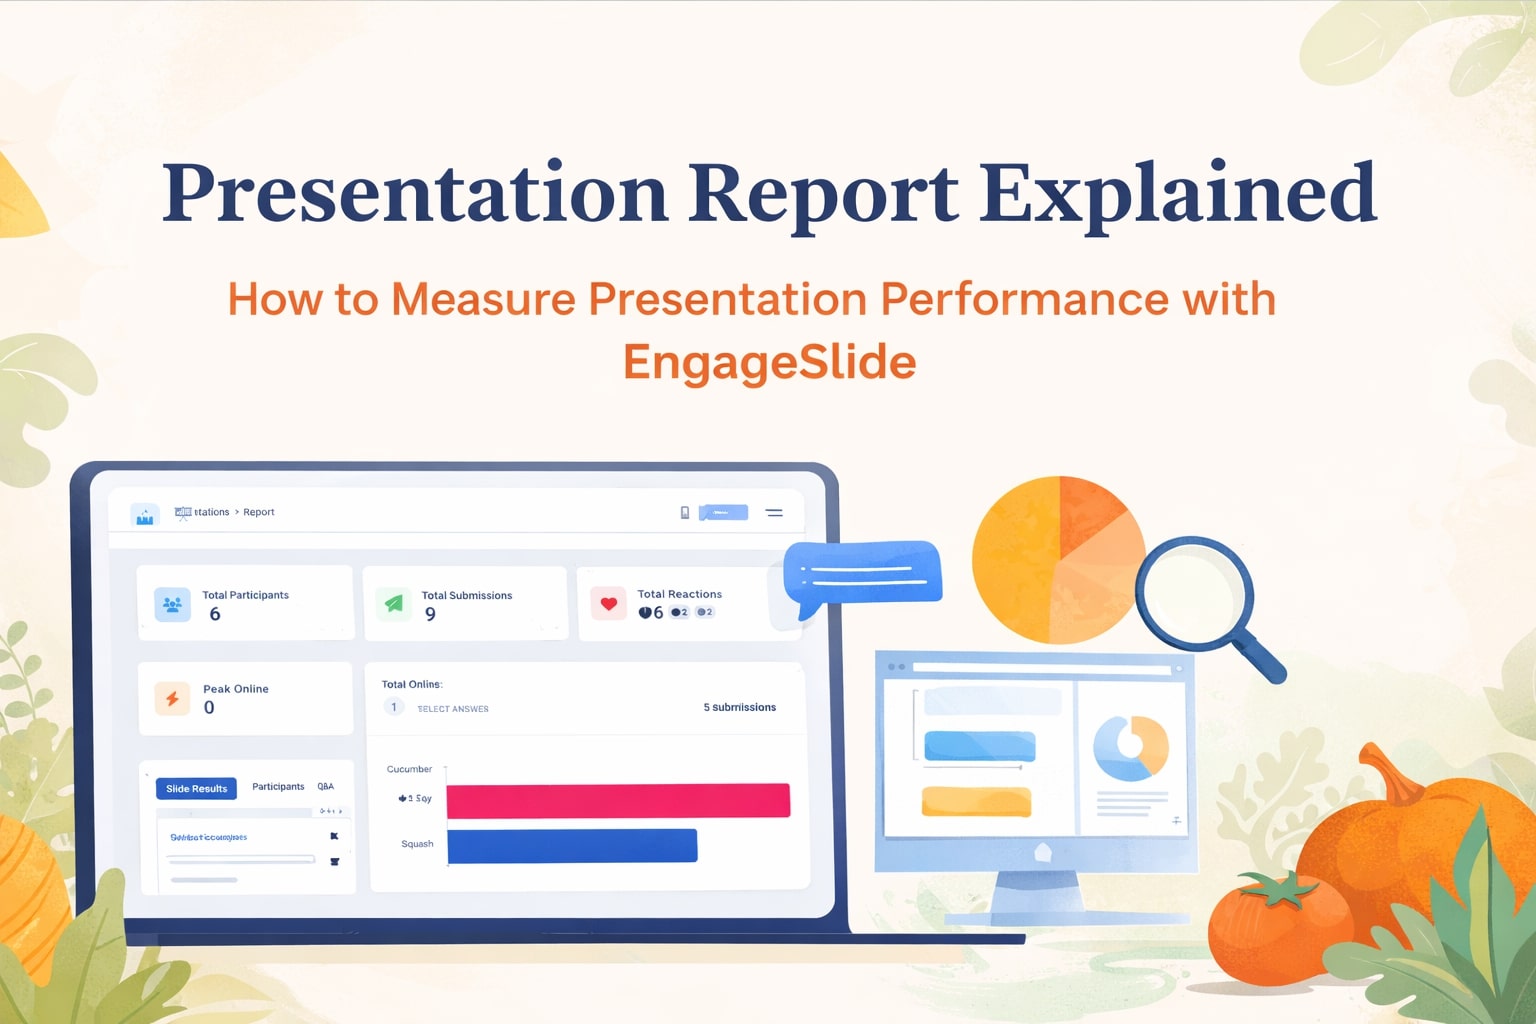
The first section of the EngageSlide report provides a high-level overview with key metrics:
Total Participants – How many people joined the presentation
Total Submissions – Number of answers submitted across all slides
Peak Online – Maximum concurrent participants
Total Reactions – Likes, votes, and other reactions
This overview answers the most important question immediately:
Was this presentation engaging or not?
Slide Results: Performance at Slide Level
One of EngageSlide’s strongest reporting features is Slide Results.
Each interactive slide — such as polls, quizzes, or multiple-choice questions — has its own detailed report. For example, in a quiz slide like “Guess the Vegetables”, EngageSlide displays:
Answer options
Number of responses per option
Visual bar charts for quick comparison
This makes it easy to:
Spot incorrect assumptions
Detect ambiguous questions
Understand audience knowledge gaps
Slide-level reporting is especially valuable for training, education, and assessments.
Participants Report: Understand Individual Engagement
Beyond aggregate numbers, EngageSlide allows presenters to analyze engagement per participant.
The Participants report helps you:
See who participated actively
Track response behavior
Measure engagement consistency
This is particularly useful for:
Corporate training sessions
Online classes
Internal workshops
Certification or compliance programs
Q&A Reporting: Capture Audience Intent
Questions asked during a presentation often reveal more than polls or quizzes. EngageSlide records:
All submitted questions
Upvotes or reactions
Timing of each question
With Q&A reports, presenters can:
Identify recurring concerns
Improve future content
Repurpose questions into FAQs, blog posts, or documentation
Instead of losing valuable audience input, everything is captured and measurable.
Exporting Presentation Reports: Excel and PDF
A presentation report is only valuable if it can be shared and reused. EngageSlide supports:
Excel Export – For deep analysis, reporting, and internal dashboards
PDF Export – For sharing with clients, managers, or stakeholders
This flexibility ensures your data is never locked inside the platform.
Use Cases for Presentation Reports with EngageSlide
Corporate Training & HR
Measure learning outcomes
Track participation
Improve onboarding and upskilling programs
Education & E-Learning
Monitor student understanding
Identify weak topics
Support data-driven teaching
Marketing & Sales
Collect live feedback during demos
Validate messaging
Use insights for follow-up campaigns
Agencies & Consultants
Provide transparent reports to clients
Demonstrate engagement metrics
Increase perceived value of presentations
Presentation Reports as a Content & Marketing Asset
Presentation reports can also fuel long-term content strategy:
Poll results → Blog insights
Quiz data → Case studies
Q&A → Help center or knowledge base
Charts → Visual content for landing pages
A single interactive presentation can generate weeks or months of valuable content.
Traditional Presentation Reporting vs EngageSlide
| Feature | Traditional Tools | EngageSlide |
|---|---|---|
| Data collection | Manual | Real-time |
| Engagement tracking | Limited | Detailed |
| Slide-level analytics | No | Yes |
| Visual reporting | Basic | Advanced |
| Export options | Limited | Excel & PDF |
Best Practices for Using Presentation Reports
To get the most value from EngageSlide reports:
Use interactive slides regularly
Review slide-level performance after each session
Compare reports across presentations
Share reports with stakeholders
Iterate and improve continuously
Conclusion: Presentation Reports Are No Longer Optional
Modern presentations are interactive, measurable, and data-driven. A strong presentation report transforms a one-time session into a continuous improvement loop.
With EngageSlide, presentation reporting becomes:
Clear
Visual
Actionable
Scalable
Instead of asking “Did the presentation go well?”, you can confidently answer with data.
Present smarter. Measure better. Improve faster — with EngageSlide.