📊Interactive Question Slides 5 min read
Poll
Survey your audience and show results live as a bar or pie chart.
What is a Poll?
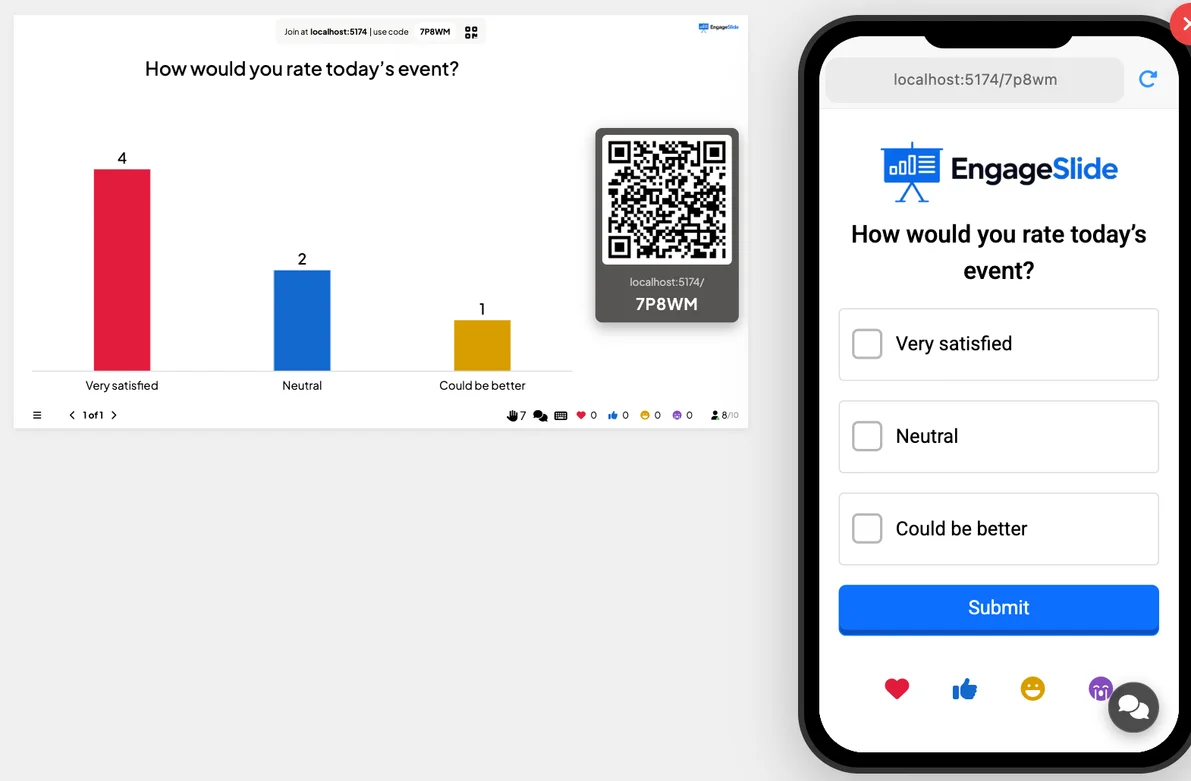
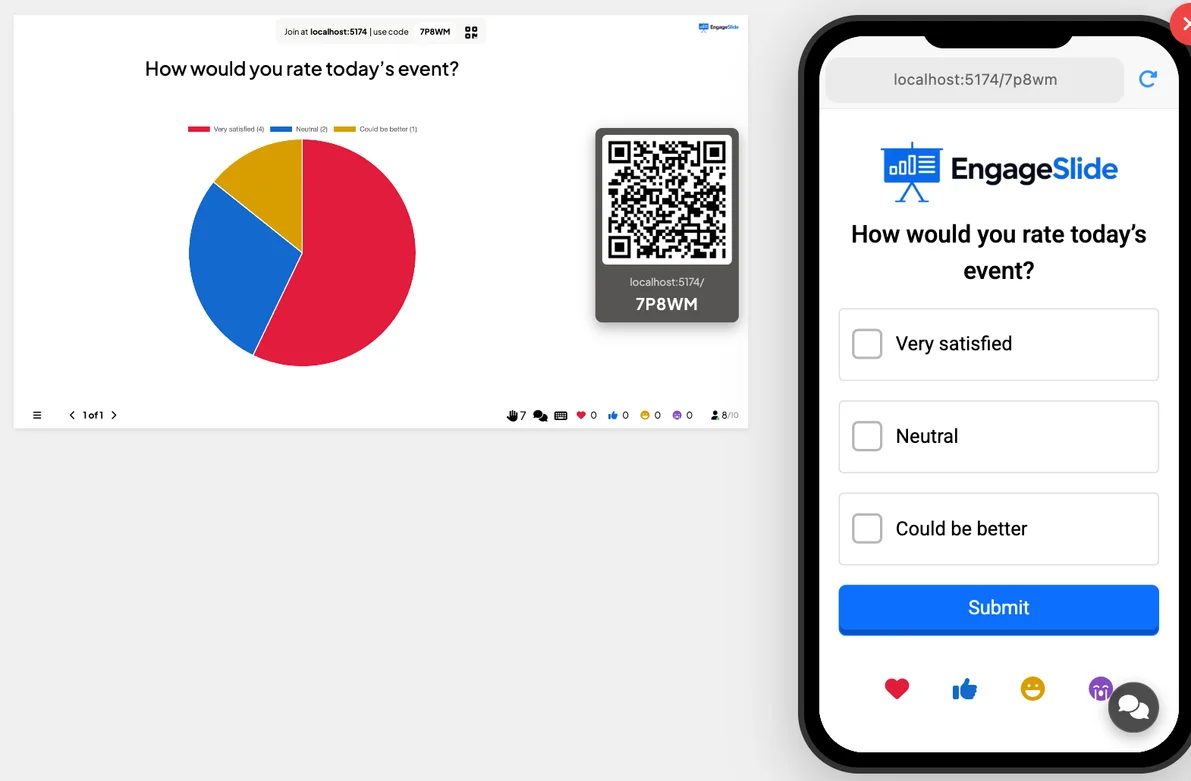
A Poll asks a question with a set of options; the audience votes from their own devices and aggregated results appear instantly on the big screen as a bar or pie chart. It is the fastest way to read the room.

Presenter creates the slide Click Present Share code / QR Audience enters code Respond & submit Real-time results
Create a Poll slide
- 1On Home, click + Create new presentation.
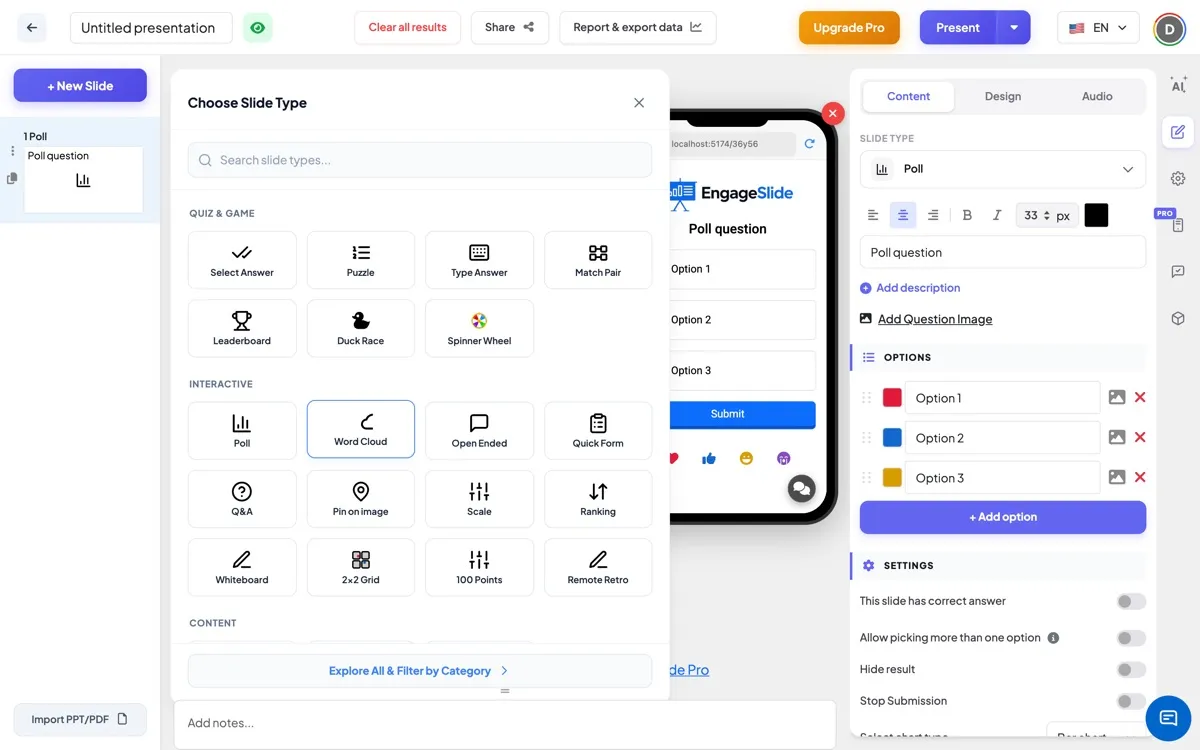
- 2In Choose Slide Type, under the Interactive Questions group, pick Poll.
- 3The slide is created and the right panel opens on the Content tab.
Enter the question & options
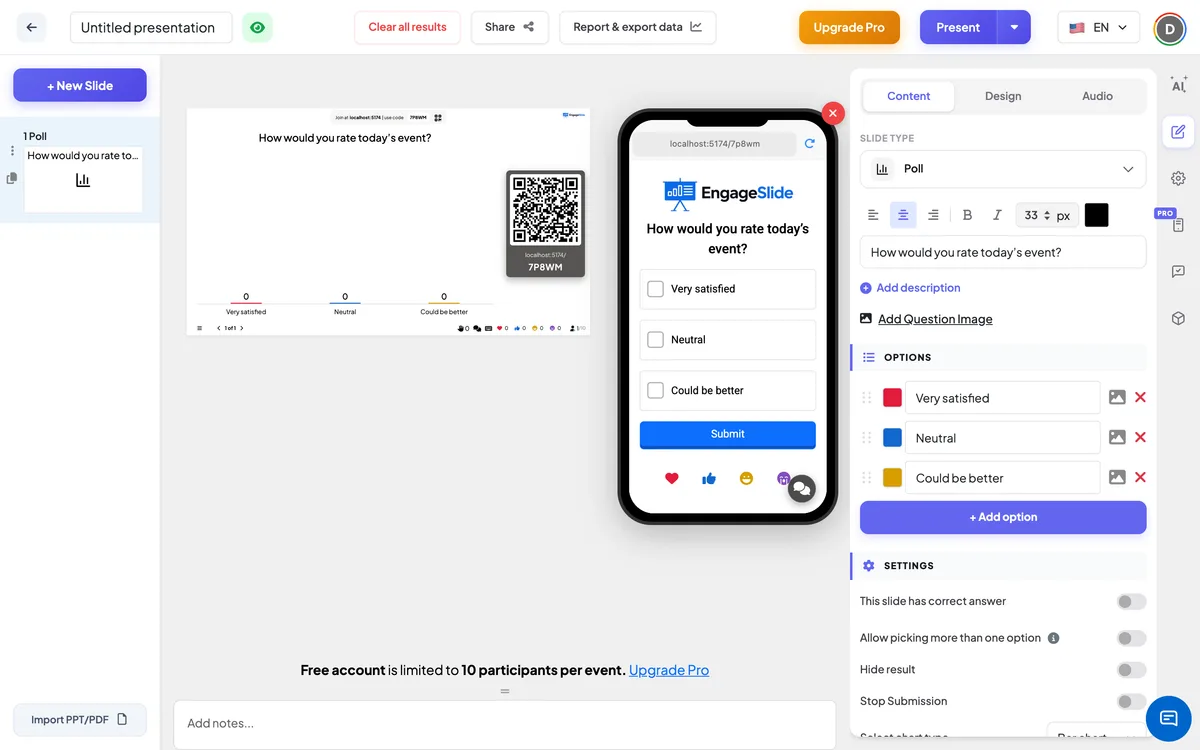
- 1Question: type it in the first field. Use Add description for an optional subtitle.
- 2Question image (optional): click Add Question Image to upload an illustration.
- 3Options: click + Add option — up to 9 options.
- 4Each option can change colour, attach an image, be reordered by drag, or deleted.
Poll settings
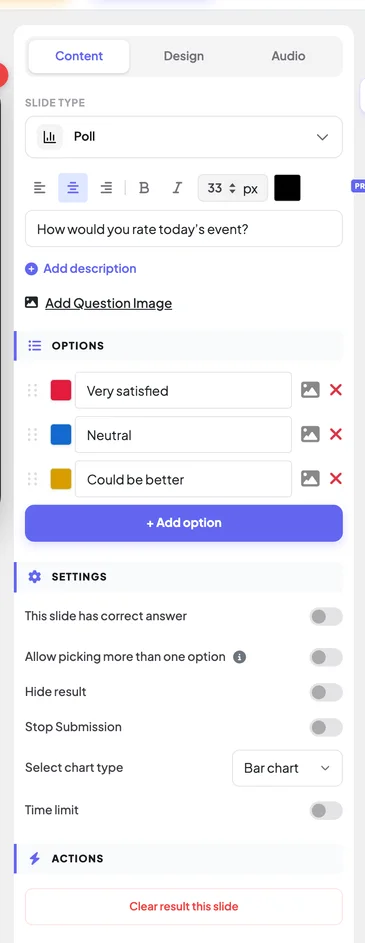
This slide has a correct answer
Turns the poll into a right/wrong question; each option gets a tick box to mark the correct one.
Allow picking more than one option
Lets the audience multi-select. Auto-enabled if you mark 2+ correct answers.
Hide result
Hides the chart while voting; click Show result to reveal it.
Stop submission
Locks voting — no more responses accepted.
Select chart type
Display results as a Bar chart or a Pie chart.
Time limit
Limit answering time; set Seconds to answer (default 60).
Present & share the join code
- 1Click Present in the top bar to put the slide on the big screen.
- 2A join code and a QR code appear (e.g.
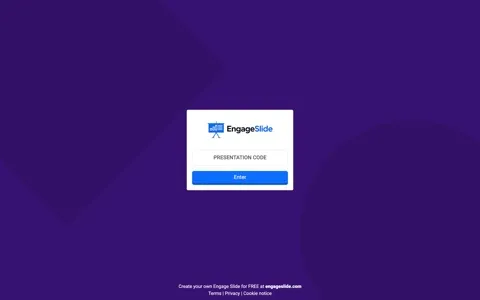
36Y56). - 3Participants open the Audience app at join.engageslide.com, type the code and press Enter — or simply scan the QR.
- 4When everyone has joined, the responses start flowing in live.
How the audience votes
- 1Participants see the question and options, and pick one (radio by default).
- 2The selected option shows a green check and border. With multi-select on, several can be checked.
- 3They press Submit; the button becomes Submitted and the list locks.
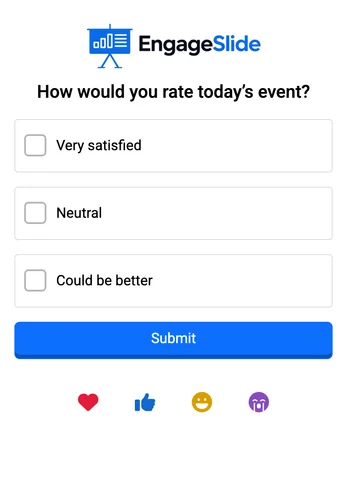
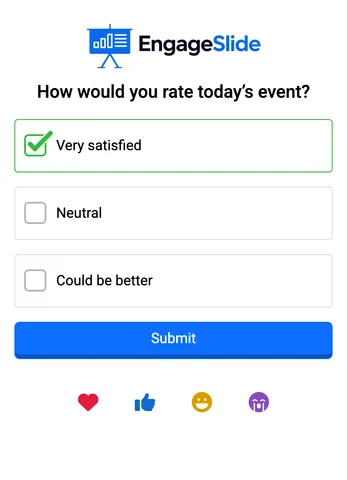
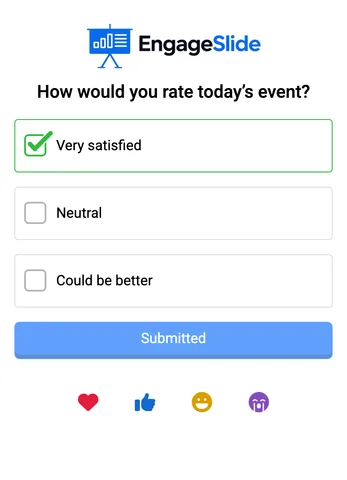
real screenshots
View results
Results update in real time on the presenter screen as a bar or pie chart with the participant count. Turn on Hide result to keep them hidden until you click Show result; if the poll has a correct answer it is highlighted on reveal. Use Report & export data in the top bar to download the detail.
Frequently asked
Can participants change their vote?
No. After Submit the options lock on their phone. To run the same poll again with a new group, click Clear result this slide under Actions.
Can people see who voted for what?
No. The chart shows how many votes each option got and the number of participants — not who picked which option.
How do I stop people from following the crowd?
Turn on Hide result. The chart stays hidden while people vote, and you reveal it with Show result once everyone has answered.
How many options can a poll have?
Up to 9. Each option can have its own colour and an image.
How do I close voting at a set time?
Turn on Time limit and set Seconds to answer, or switch on Stop submission whenever you want to close the poll yourself.